Good Continuing Healthcare reporting shows ICBs where decisions are late, where money goes and which patients wait longest. In most systems the data sits in case management tools, spreadsheets, brokerage logs and finance exports. Few teams have one trusted view of it.
NHS Continuing Healthcare (CHC) is one of the most complex and costly services an Integrated Care Board commissions. Each quarter brings referrals, assessments, Fast Track packages and Discharge to Assess placements. It also brings reviews, appeals, personal health budgets and invoices. Every one of these needs tracking, explaining and reporting to NHS England.
At Business Intelligence Atlas we build Continuing Healthcare Power BI reporting in Microsoft Fabric. It gives CHC teams, finance leads and ICB boards one source of truth. To show what that looks like, we built a full CHC Power BI dashboard demo: 15 pages covering the whole CHC pathway, on fully anonymised synthetic data. This article walks through every page, the logic behind it and the value it adds.
Watch the CHC Power BI dashboard demo
A 90-second walkthrough of the NHS Continuing Healthcare dashboard, clicking through each page and filter:
What CHC reporting needs to cover
Effective CHC reporting follows a person through the whole pathway, from referral to review, and links activity to cost. When we design NHS Continuing Healthcare dashboards, these are the reporting areas ICBs, CSUs and CHC providers ask for most:
| Reporting area | Key questions answered |
|---|---|
| Referrals and assessment | How many Checklists are positive? Are 80% of Standard decisions made within 28 days? How many referrals wait over 12 weeks? |
| Fast Track and end of life | Is care in place within 48 hours? Are preferred places of death met? |
| Hospital discharge and D2A | How many people are medically optimised but still in hospital? Who has been in a D2A bed over 28 days? |
| CHC reviews and recovery | How quickly is the overdue review backlog clearing, and what savings are identified? |
| Brokerage and commissioning | How fast are packages sourced, and at what price against framework rates? |
| Complex care, Section 117 and joint funding | Where are the high-cost, high-risk packages? How are costs split between the NHS and local authorities? |
| Personal health budgets | How many people receiving CHC at home have a PHB? How well are budgets used? |
| Appeals and retrospective claims | How many Local Resolution, IRP and PUPoC cases are open, and what restitution has been paid? |
| Finance and invoicing | Is CHC spend on budget? Are providers paid on time? |
| Quality and workforce | Are assessments defensible? How productive is each assessor? |
Covering all ten areas in one CHC performance reporting model avoids the most common problem we see: separate spreadsheets that disagree with each other.
Inside our Continuing Healthcare Power BI dashboard: page by page
The demo has 15 pages. Each one follows the same layout: filters at the top, headline KPIs, three or four charts, and the detailed records at the bottom. All patient identifiers show as “Anonymised”.
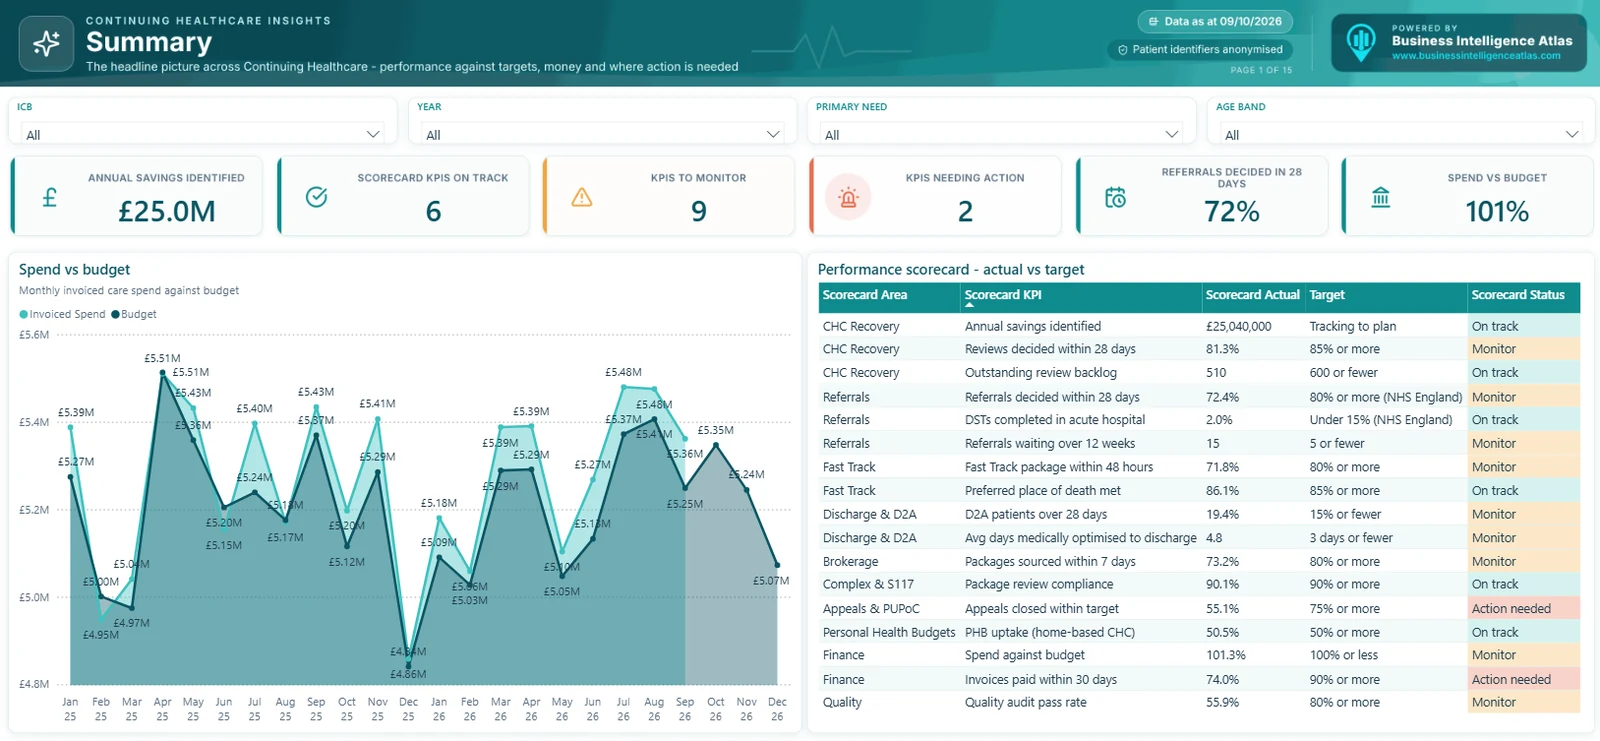
1. Summary – the CHC picture on one page
The Summary page is the front door to the Continuing Healthcare dashboard. A performance scorecard rates 17 measures against target as On track, To monitor or Action needed, with a count of each at the top. Charts show spend against budget over time alongside the scorecard detail. Value: a director sees in 30 seconds where to focus.
2. KPIs – every headline number, one time period
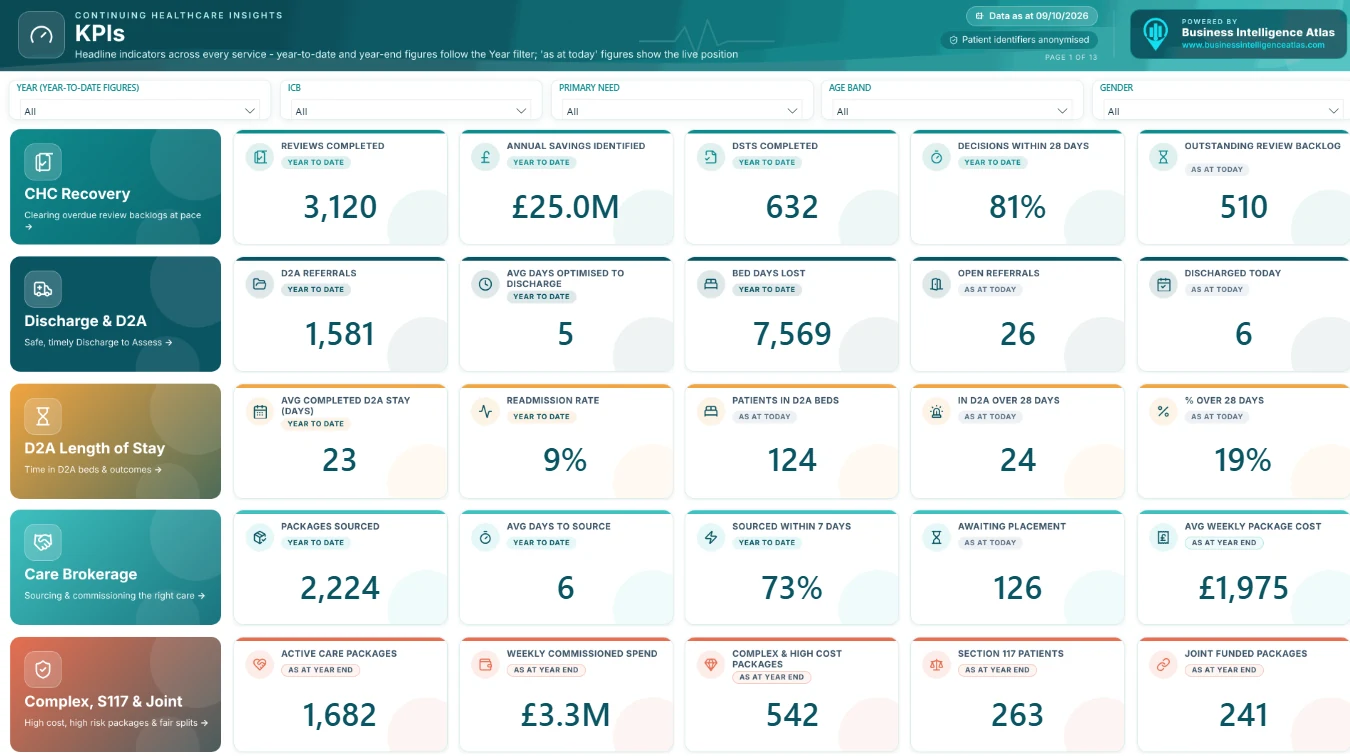
Twenty-five KPI cards, grouped by service, each labelled Year to date, As at today or As at year end. Each service panel links through to its detail page. Value: board and committee CHC KPI reporting without manual collation.
3. Executive Overview
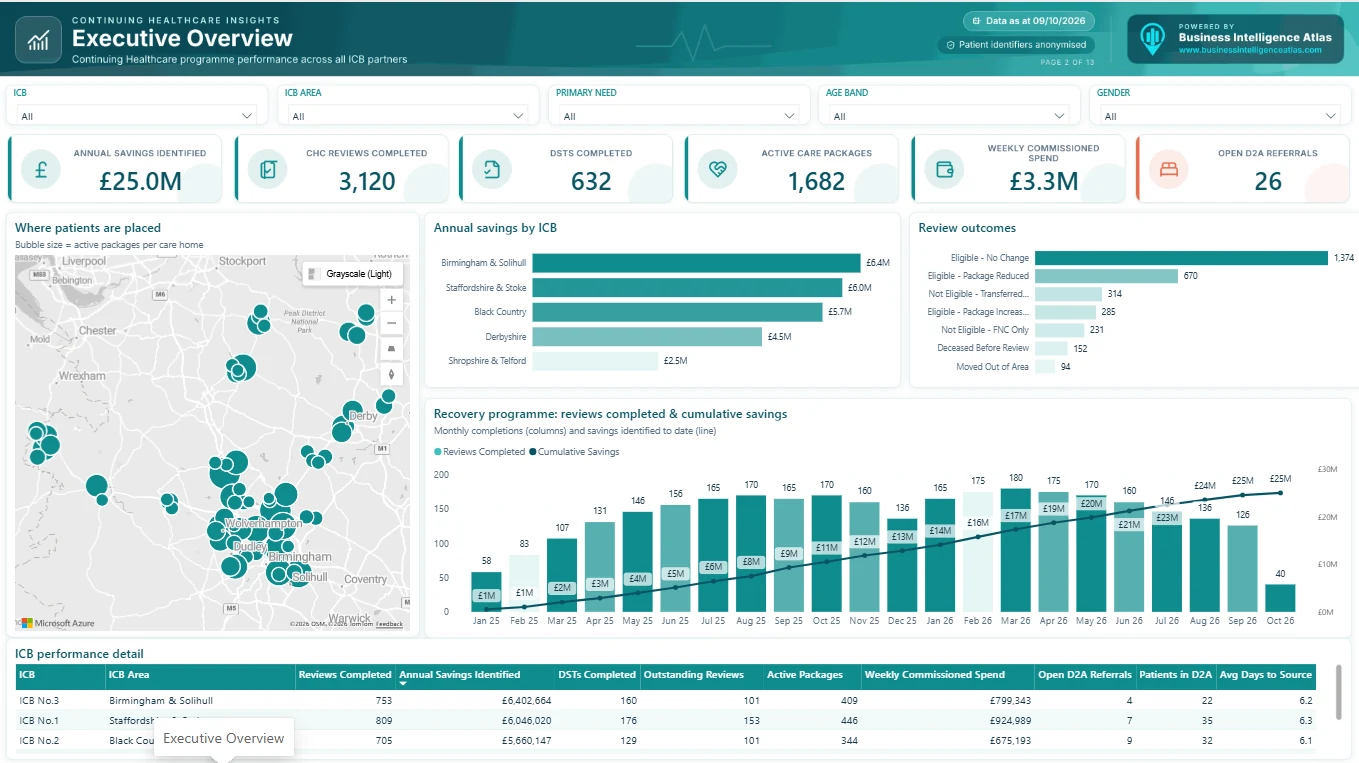
A map of active placements by care home, savings by ICB, review outcomes and funding mix. Value: a strategic view of where people are placed and where money goes.
4. CHC Recovery Programme
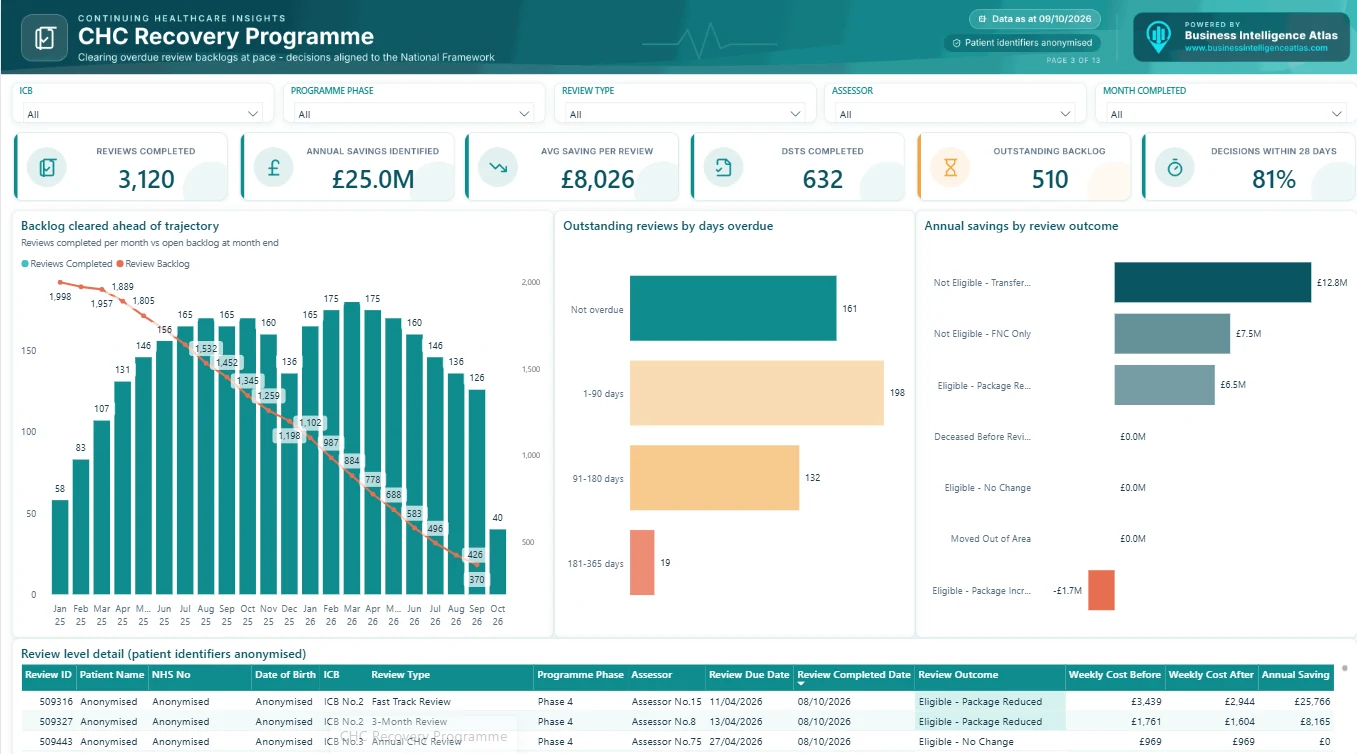
Tracks overdue review backlogs falling month by month against reviews completed. It also shows savings by outcome (package reduced, transferred to the local authority, Funded Nursing Care), DSTs completed and decisions within 28 days. Value: evidences the return on a CHC recovery programme and keeps it on trajectory.
5. CHC Referrals & 28-Day Standard
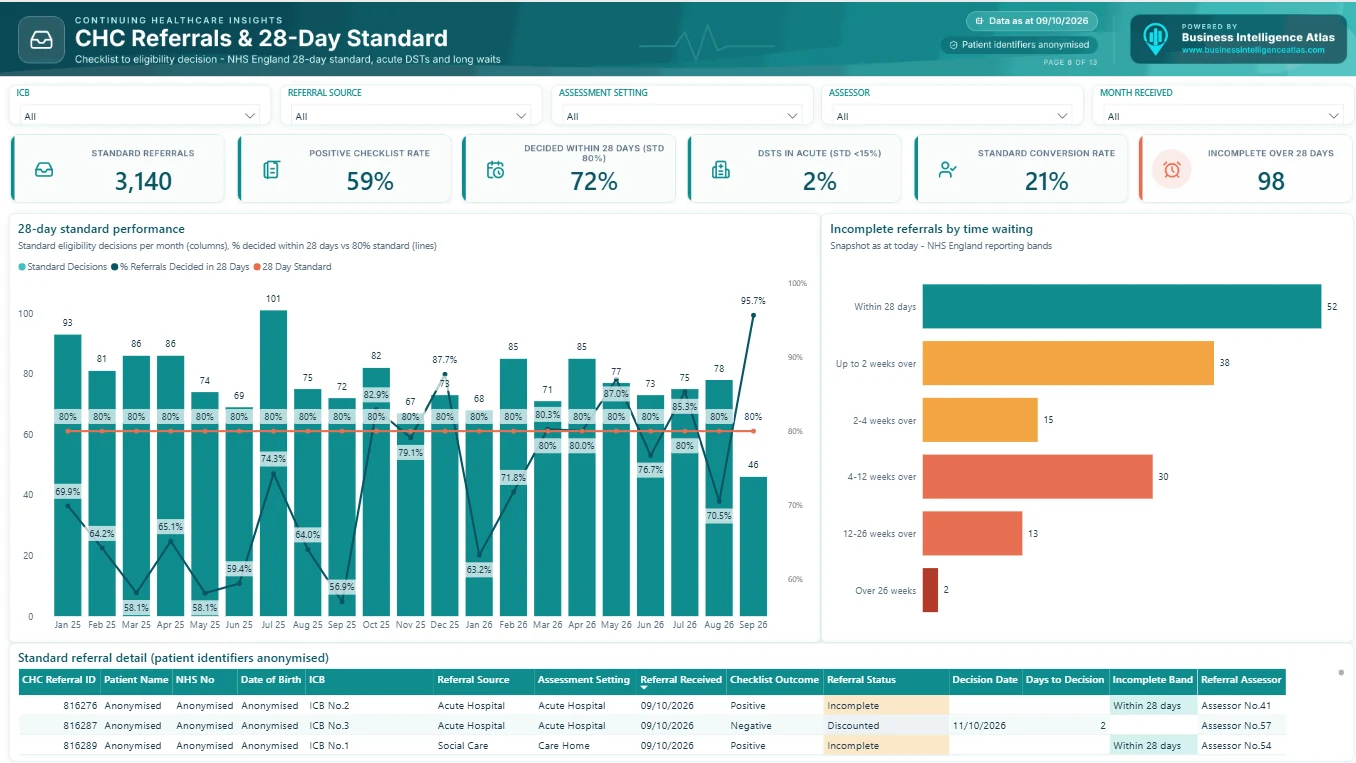
Measures Standard referrals, the positive Checklist rate and the % of decisions made within 28 days against NHS England’s 80% expectation. It also covers the share of DSTs completed in acute settings (expected under 15%), conversion rate and incomplete referrals in NHS England’s waiting bands. Value: monthly CHC 28-day standard reporting that matches the national data collection.
6. Fast Track & End of Life Care
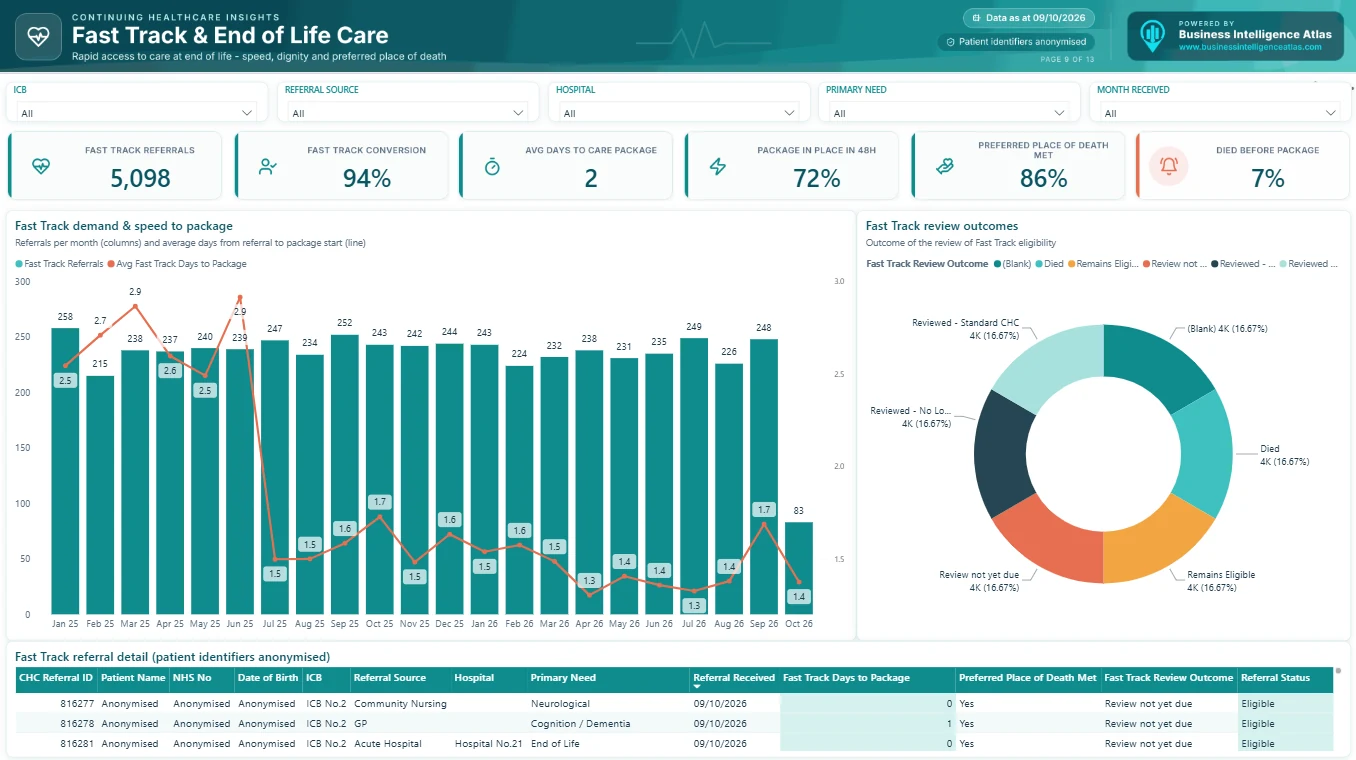
Covers Fast Track demand, conversion, days to care package, % of packages in place within 48 hours, preferred place of death met and Fast Track review outcomes. Value: makes sure the most time-critical CHC pathway is fast and dignified.
7. Hospital Discharge & D2A
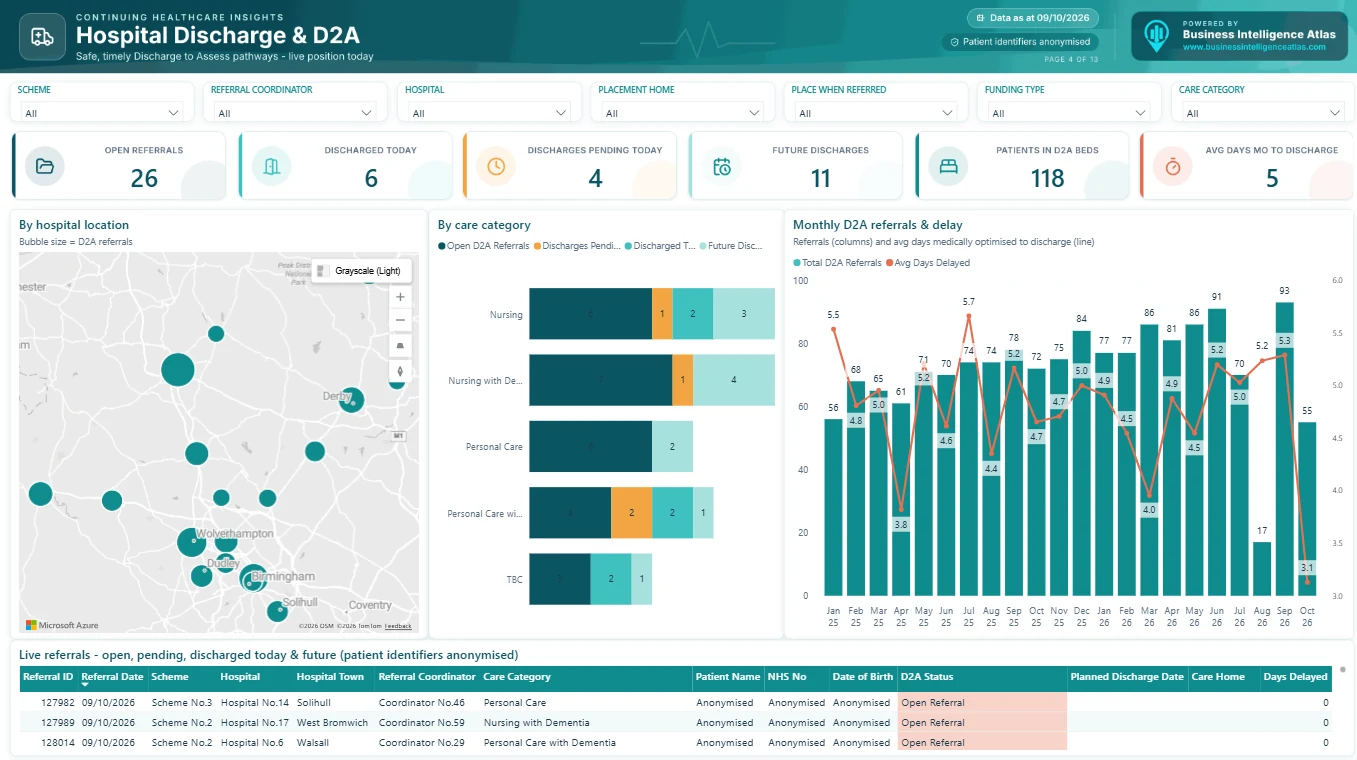
A live Discharge to Assess (D2A) dashboard. It shows open referrals, discharges today, pending and future discharges, days from medically optimised to discharge and bed days lost, split by hospital, care category and pathway, with a hospital map. Value: daily flow management for discharge hubs.
Want to click through it yourself? We can give you live access to the demo Power BI report, or get in touch for a no-obligation chat about your own CHC reporting.
8. D2A Length of Stay
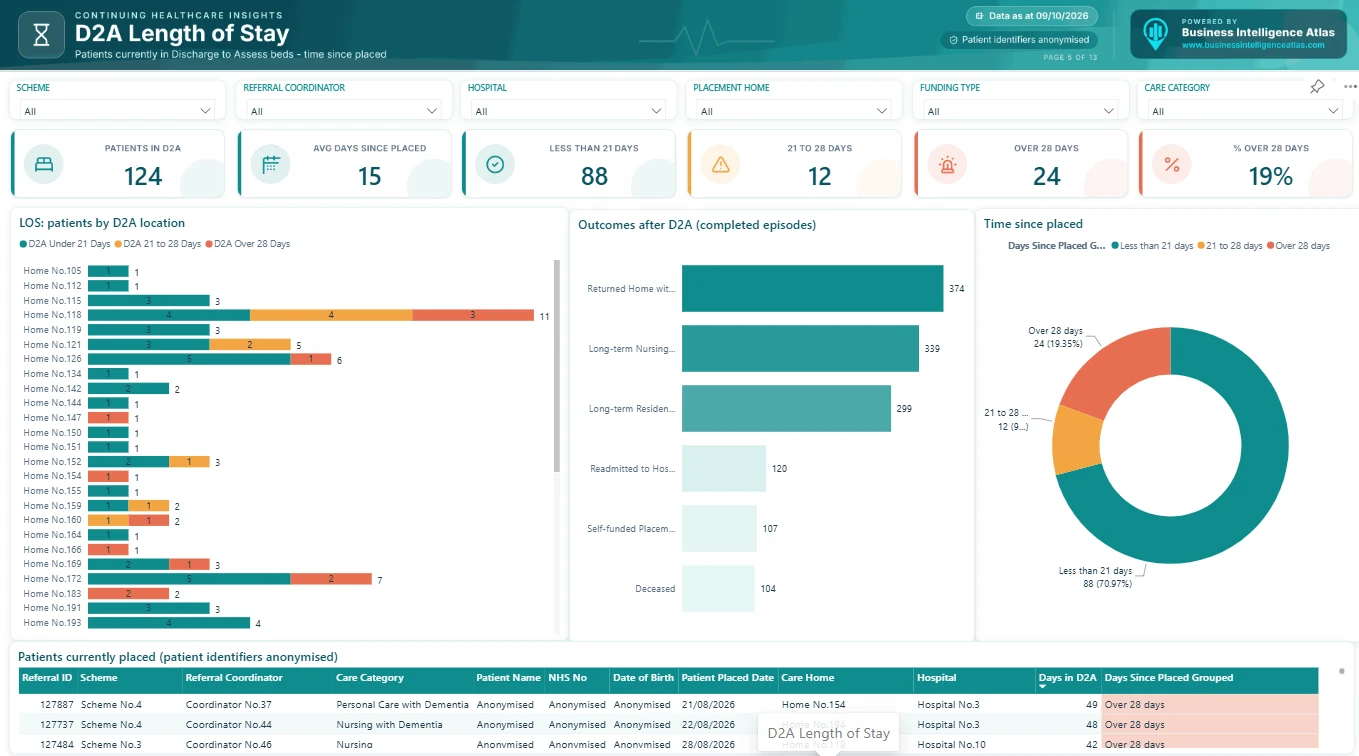
Patients in D2A beds banded as under 21 days, 21–28 days and over 28 days, by hospital and care home. It also shows outcomes after D2A and readmission rates. Value: stops interim placements quietly becoming long-term.
9. Care Brokerage & Commissioning
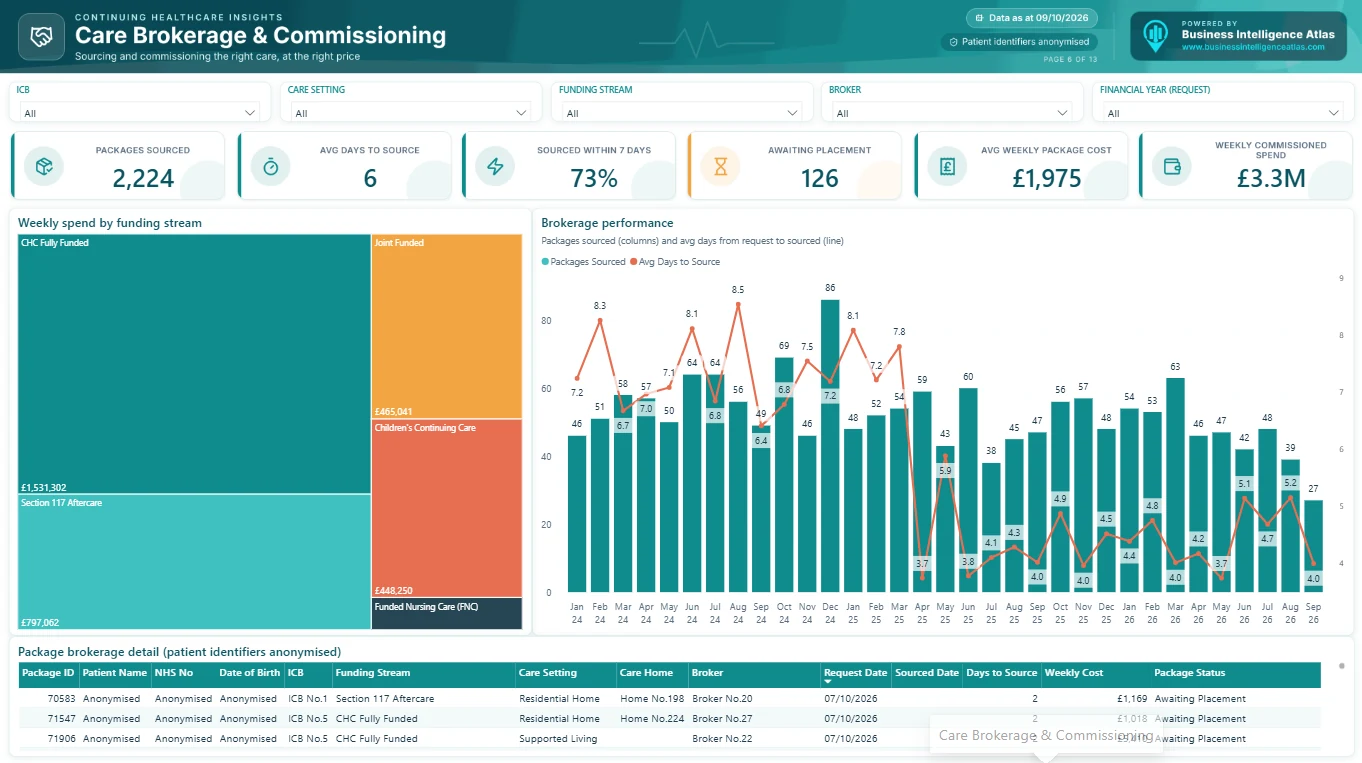
Shows packages sourced, average days to source, % sourced within 7 days, people awaiting placement, average weekly cost and price variance against framework rates. Value: better CHC commissioning decisions and fair prices.
10. Complex Cases, S117 & Joint Funding
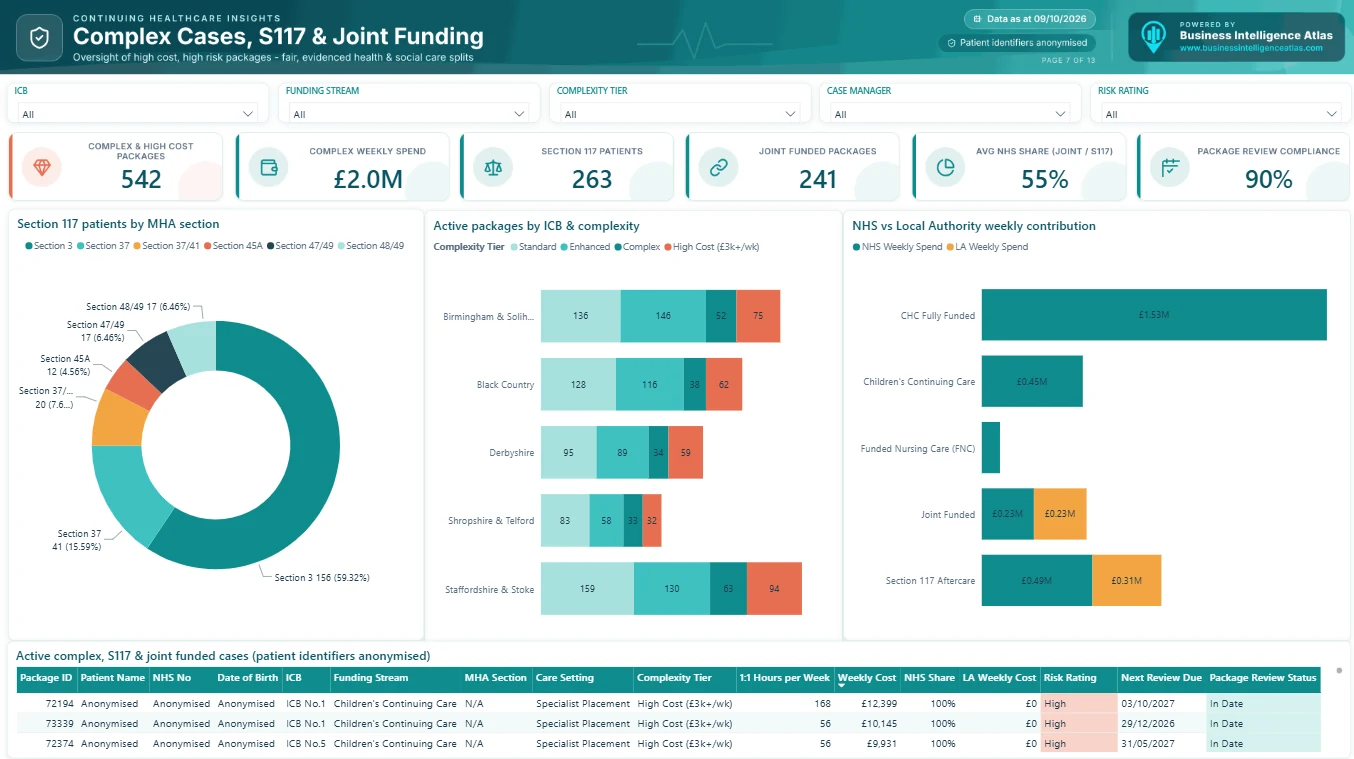
Covers high-cost and complex packages, Section 117 aftercare reporting by Mental Health Act section, and the NHS and local authority split for joint-funded care. It also tracks package review compliance. Value: oversight of the packages that carry the most cost and risk.
11. Appeals, Disputes & Retrospective Claims
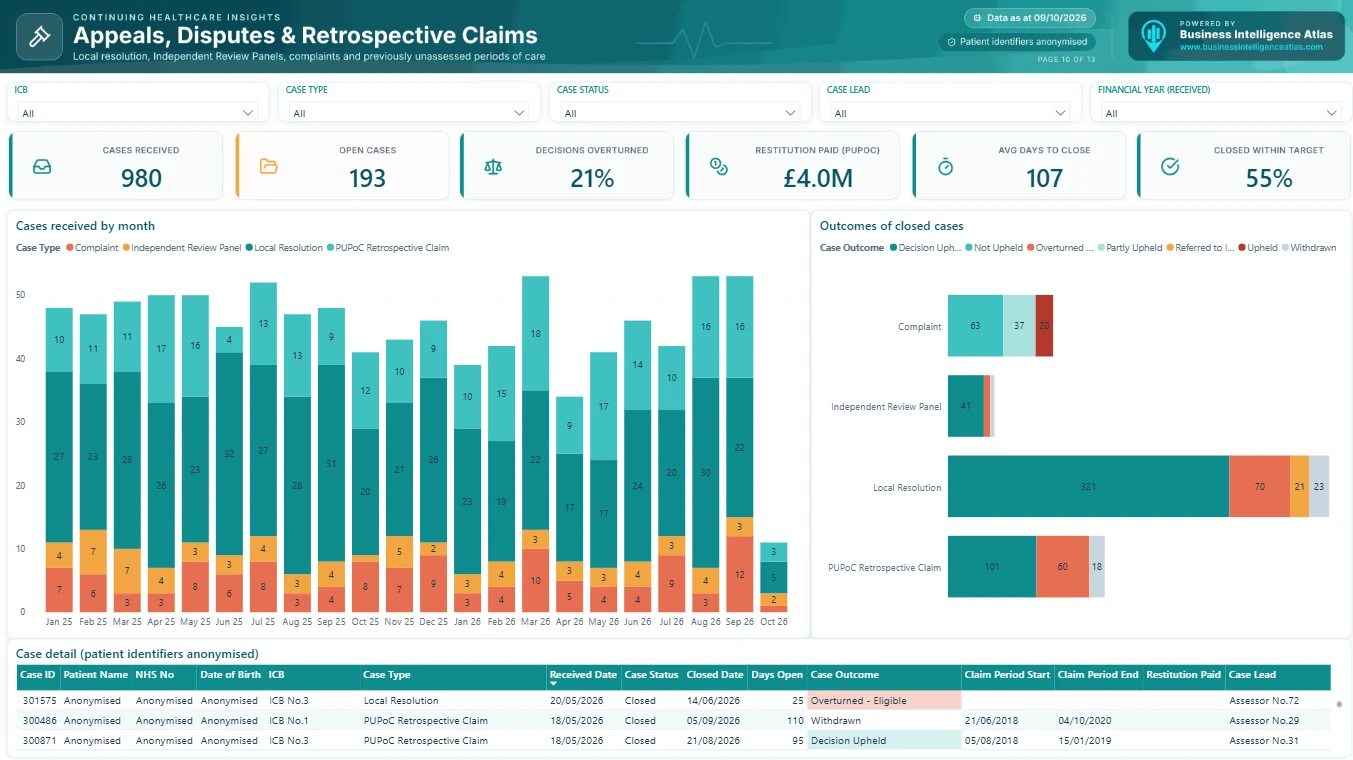
Tracks Local Resolution, Independent Review Panels, complaints and PUPoC retrospective claims. It shows open cases by age, % of decisions overturned, restitution paid and cases closed within target. Value: reduces legal and financial risk.
12. Personal Health Budgets
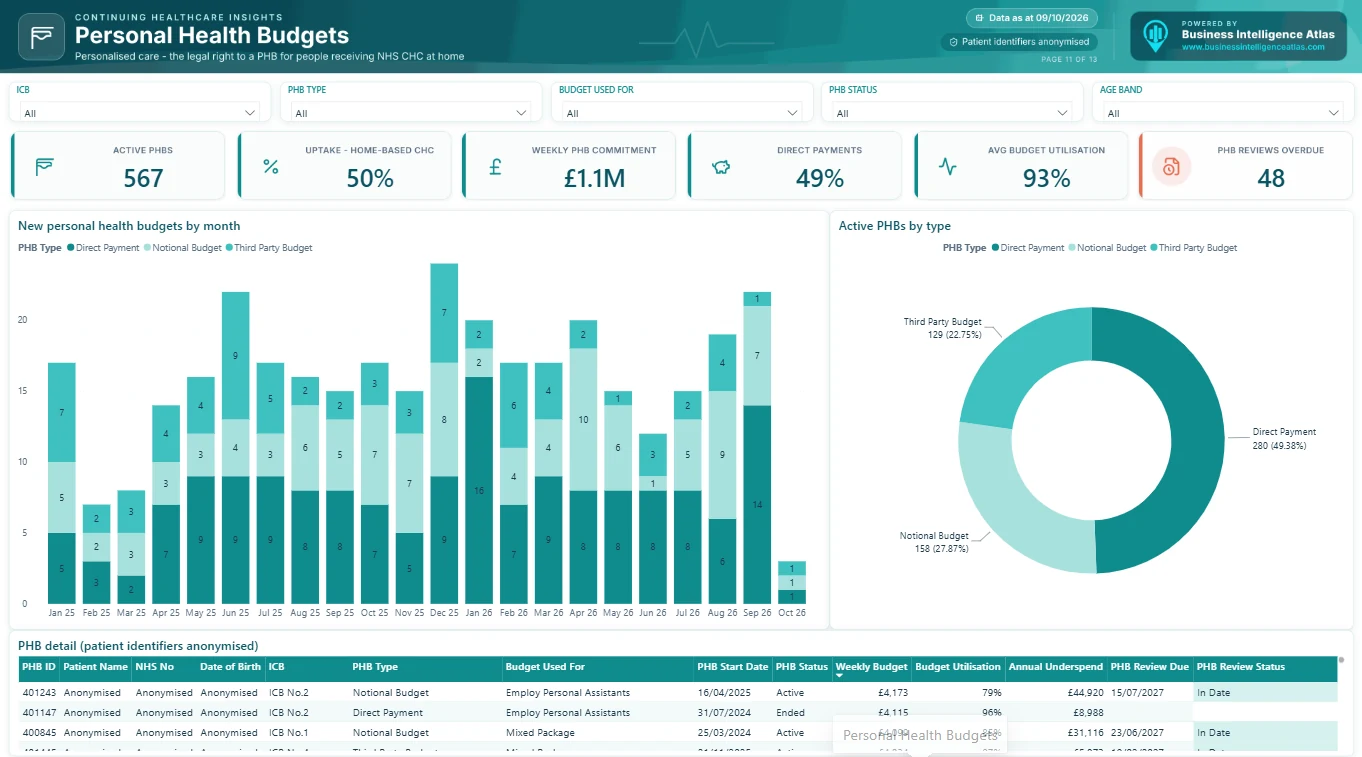
Shows active PHBs, uptake among people receiving CHC at home, the split between direct payments, third-party and notional budgets, budget use, underspend and overdue reviews. Value: evidence for the legal right to a PHB and for personalised care plans.
13. Finance & Invoicing
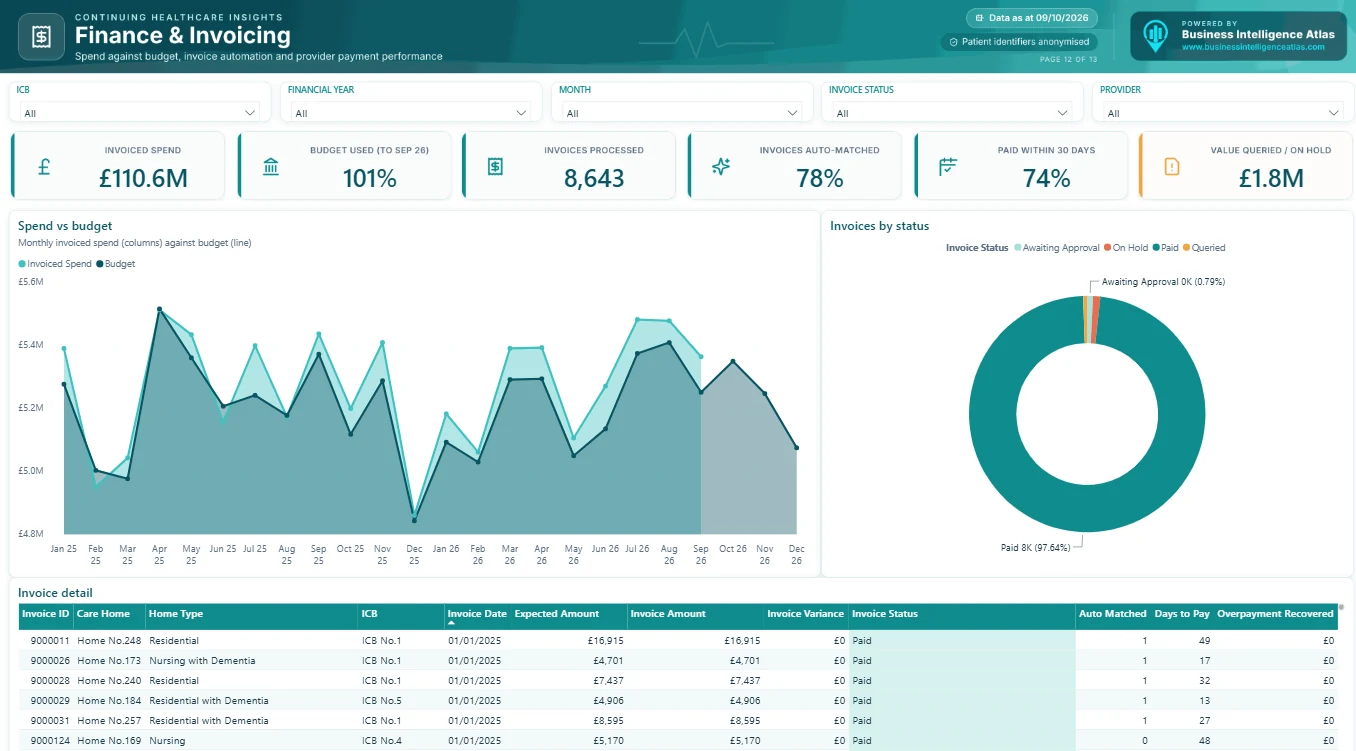
Covers invoiced spend against budget, % of invoices matched automatically, % paid within 30 days, value queried or on hold, and spend by home type. Value: joins CHC finance reporting to activity, so budget conversations use the same numbers as operations.
14. Quality Assurance & Workforce
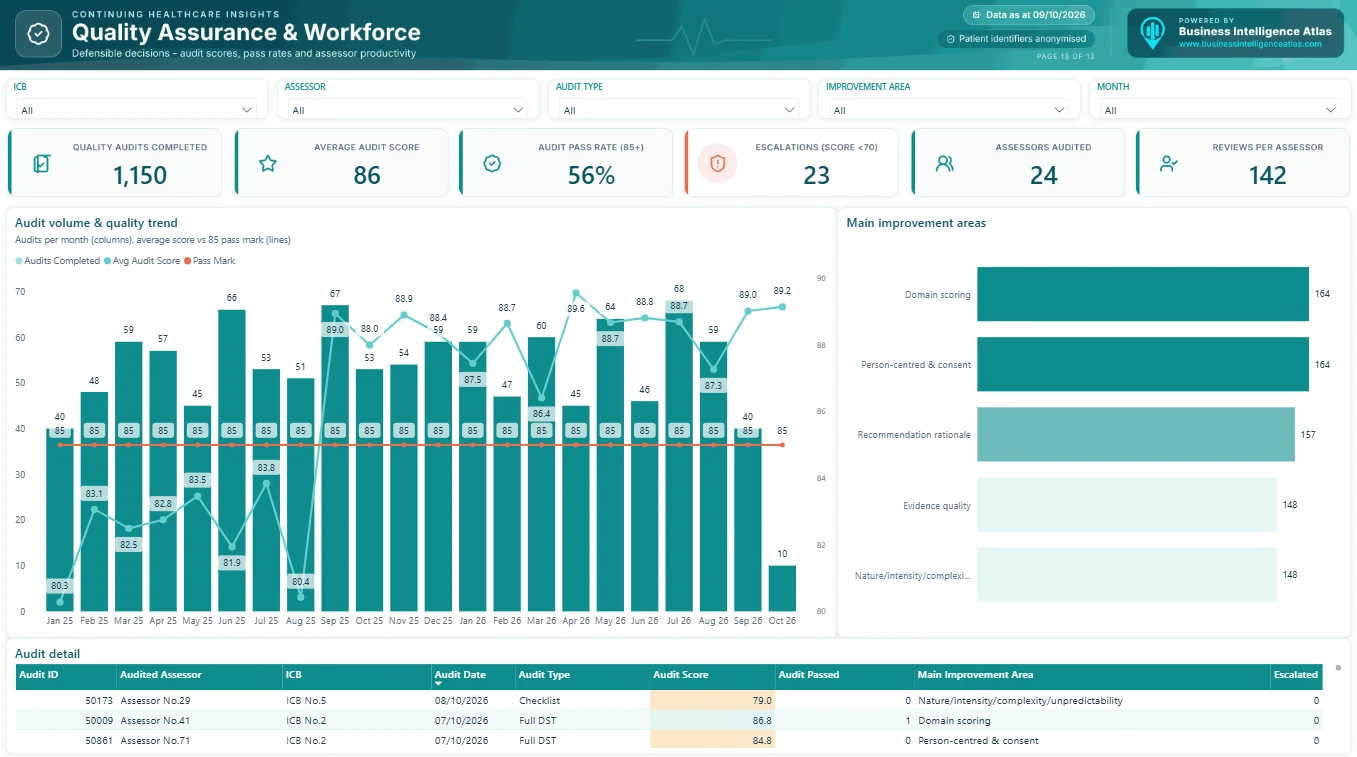
Shows audit scores against an 85% pass mark, pass rate, escalations, the most common improvement areas and reviews completed per assessor. Value: defensible decisions and a clear view of capacity.
15. Glossary
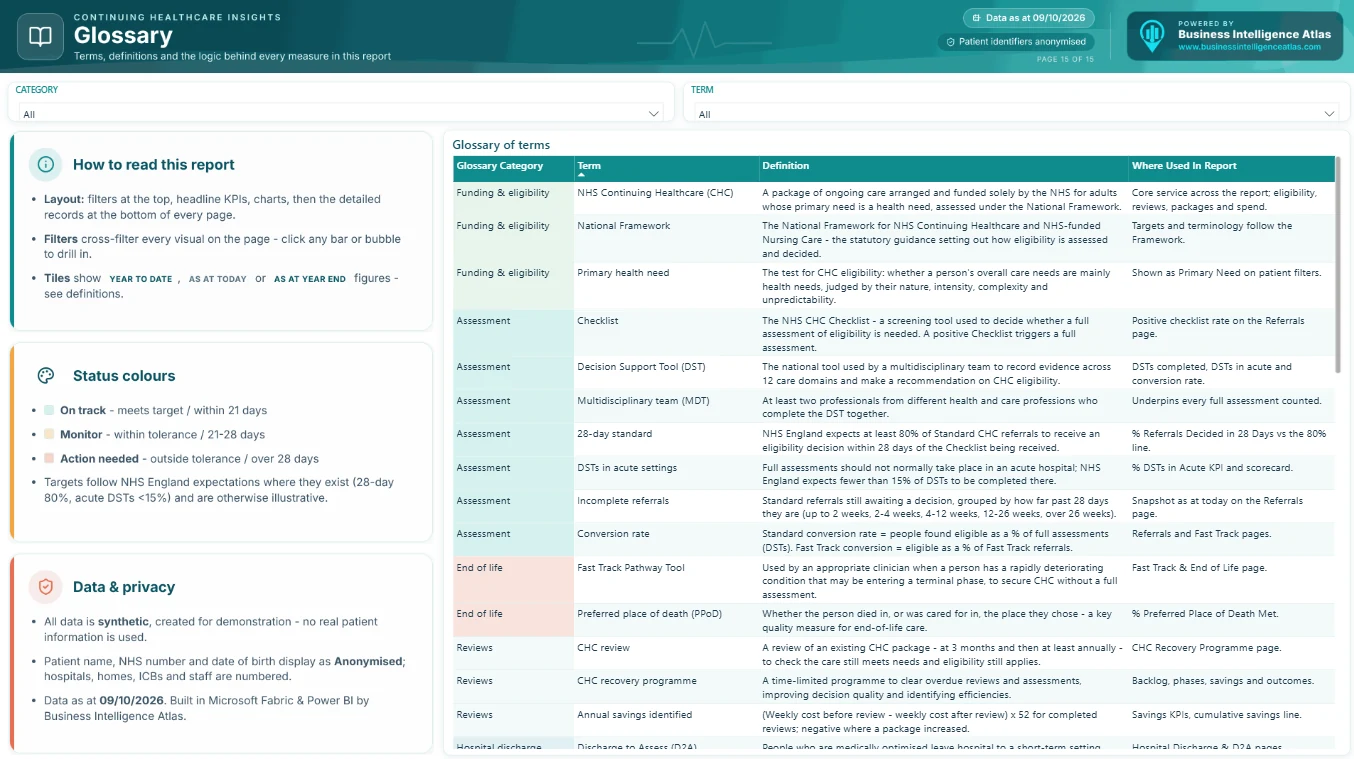
More than 40 definitions, from DST, Checklist and PUPoC to D2A pathways, FNC and “as at year end”. It also explains how to read the report and what the status colours mean. Value: new staff, finance colleagues and board members all read the report the same way.
Built around NHS England CHC data and the National Framework
Our CHC Power BI reporting uses the same definitions as NHS England’s quarterly Continuing Healthcare and Funded Nursing Care data collection, so your local dashboard and your national return agree. That includes:
- Standard and Fast Track referrals received, completed and discounted
- Standard referrals completed within 28 days (77% nationally in Q3 2025/26)
- Incomplete referrals waiting over 28 days, in NHS England’s bands (up to 2 weeks, 2–4 weeks, 4–12 weeks, 12–26 weeks, over 26 weeks)
- DSTs completed in an acute hospital setting
- Standard and Fast Track conversion rates
- Local Resolution requests and Previously Unassessed Periods of Care (PUPoC)
Terms such as primary health need, the Checklist and the Decision Support Tool follow the National Framework for NHS Continuing Healthcare and NHS-funded Nursing Care. Targets that are local choices, such as the 7-day brokerage goal, can be set per ICB in the Continuing Healthcare dashboard scorecard.
Source: NHS England, NHS CHC and NHS-funded Nursing Care, Q3 2025/26.
Data, security and mobile access
We build Continuing Healthcare analytics in Microsoft Fabric and Power BI, inside your own NHS Microsoft tenancy, so patient data never leaves your environment.
- One semantic model. Referrals, reviews, D2A, packages, PHBs, appeals, invoices and audits share the same dimensions: ICB, hospital, care home, patient and date. Filtering by an ICB filters every page.
- Connects to your systems. CHC case management systems, brokerage tools, finance exports, PLDS returns or spreadsheets. The data refreshes automatically on a schedule.
- Privacy by design. Row-level security limits each ICB, team or provider to its own records. Identifiers can be masked or shown only to authorised roles.
- Mobile CHC reporting. Every page has a phone layout, so on-call managers and discharge leads can check D2A flow or Fast Track performance on the move.
- Clear time logic. Each KPI is labelled Year to date, As at today or As at year end, so nobody compares a snapshot with a cumulative total by mistake.
The demo shown here uses only synthetic data. Patient name, NHS number and date of birth display as “Anonymised”, and hospitals, homes, ICBs and staff are numbered.
How we deliver Continuing Healthcare Power BI reporting
A senior Microsoft Fabric and Power BI consultant who understands the CHC pathway does the work from start to finish, with no hand-offs to junior staff. The timeline below is for Phase 1: the first release of your dashboard, covering the highest-priority reporting areas. See how we work.
- Discovery call (free). We agree the reporting questions, your systems and NHS England returns, and what “good” looks like for your ICB or service.
- Data audit (week 1). We map your CHC case management, brokerage, finance and discharge data, and agree definitions such as the 28-day clock and “active package”.
- Build (weeks 2–4). The semantic model, pages and mobile layouts, starting from the proven design in this demo.
- Test with your team (week 5). Numbers are reconciled to your national submission and finance ledger.
- Phase 1 go-live and handover. Scheduled refresh, row-level security, user training and documentation for the first release.
- Further phases and continuous improvement. Once Phase 1 is live, new requirements, extra data sources and additional pages usually follow. As part of continuous improvement, further delivery phases are often needed to cover every requirement, each planned and agreed with you.
Tailored to your service and your data
The demo is a starting point, not a fixed product. Every Continuing Healthcare reporting solution we deliver is customised to your needs: the pages, KPIs, targets and definitions your ICB or organisation uses, your branding, and – most importantly – your own data systems, whether that is a CHC case management system, brokerage platform, finance ledger, NHS England returns or a set of Excel trackers. Pages can be added, removed or redesigned, and the model can be extended to adjacent services such as adult social care, mental health or community care.
Whether you need a single CHC dashboard for a recovery programme, or full All Age Continuing Care reporting across adults, children, Section 117 and FNC, the model scales with you.
Frequently asked questions about CHC reporting
What is Continuing Healthcare reporting?
Continuing Healthcare reporting (CHC reporting) is how ICBs and CHC providers track referrals, eligibility decisions, care packages, reviews and spend for NHS Continuing Healthcare. It covers both performance against national standards and local management information.
Can Power BI produce our NHS England CHC data collection figures?
Yes. A well-designed Continuing Healthcare Power BI model calculates the 28-day standard, incomplete referral bands, acute DST share, conversion rates, Local Resolution and PUPoC counts from your case-level data, so the quarterly return can be checked against the dashboard.
Which systems can a CHC dashboard connect to?
Most CHC case management and brokerage systems can export to SQL, CSV or an API. Power BI and Microsoft Fabric connect to all of these, plus Excel trackers and finance systems.
Is a CHC Power BI dashboard secure for patient data?
It runs inside your own Microsoft 365 / Fabric tenancy, with row-level security and role-based access. The demo on this page uses only synthetic, anonymised data.
Do you cover Discharge to Assess, Section 117 and personal health budgets?
Yes. The same model covers D2A and hospital discharge, Section 117 aftercare, joint funding, Funded Nursing Care, children and young people’s continuing care, and personal health budgets.
How long does a Continuing Healthcare dashboard take to build?
Phase 1 – the first release of the dashboard – typically takes four to six weeks from discovery to go-live, depending on data access and scope. A focused CHC recovery programme dashboard can be live sooner. Covering every requirement usually takes further phases of delivery, added as part of continuous improvement as your needs and data sources grow.
Can we see the CHC dashboard on a phone?
Yes. Every page has a mobile layout for the Power BI mobile app.
Can I try the demo report myself?
Yes. Contact us and we will send you live access to the interactive demo Power BI report so you can click through every page and filter.
See the CHC Power BI dashboard in action
Want live access to the demo Continuing Healthcare Power BI report, so you and your team can click through it yourselves? Or would you like a chat about your own CHC reporting – a recovery programme, the 28-day standard, D2A flow or CHC finance?
Everything you see here can be tailored to your organisation’s requirements and connected to your own data systems.
Get in touch. We’ll send you a link to the live demo, or book a free 30-minute call to walk through the dashboard and show how it would look with your data.
Business Intelligence Atlas – senior Microsoft Fabric and Power BI consultancy for the NHS and healthcare.
Comments are closed